
The Proper Adjustment of Your Headrest Could Save Your Neck
Recently, there has been some attention focused on the rising costs of auto insurance premiums. These rising costs are due to a number of factors, including the prevalence of soft tissue injuries, such as whiplash. Properly adjusted headrests can dramatically reduce the number and severity of soft tissue injuries resulting from rear-end collisions. Ideally, good headrest adjustment depends first on the design of the headrest, and second (in many instances) on the diligence of drivers and passengers in making the necessary adjustments.
The study of headrest adjustment rates
Insurance Bureau of Canada (IBC) commissioned a national study to assess whether Canadians are adjusting their car headrests properly. The study was conducted in seven provinces, of which six have auto insurance sold by privately held insurance companies insuring against personal injury. The results are being used to increase public awareness and education about the ideal adjustment for headrests, in order to decrease the number and severity of soft tissue injuries related to whiplash across Canada.
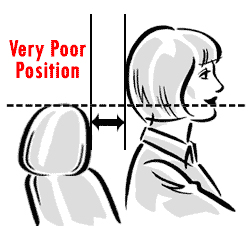
The IBC study was conducted in British Columbia, Alberta, Ontario, New Brunswick, Nova Scotia, Prince Edward Island and Newfoundland and Labrador during June and July 2002. A total of 7,571 drivers and 1,090 passengers were videotaped as they approached intersections and in stop-and-go traffic. Drivers and passengers captured on film were rated according to where the top of the headrest was relative to the head (vertical adjustment) and the distance between the back of the head and the front of the headrest (backset or horizontal adjustment). Based on these measures, overall adjustment was categorized as good, marginal, poor or very poor.
Scoring - Headrest Adjustment |
||
Score |
Vertical |
Horizontal |
Good |
Between top of ear and top of head |
Less or equal to ear width |
Marginal |
Between top and bottom of ear |
Greater than ear width but less than half head width |
Poor |
Lower than bottom of ear |
More than half head width but less than one head width |
Very Poor |
Unable to see it |
Greater than head width |
Study findings for the drivers
- Only 14% of drivers had their headrest in the good position. For 53% of the drivers observed, the adjustment was so inadequate that it would not protect them from injury in a rear-end collision.
- Of the provinces assessed, good headrest adjustment rates varied from seven to 18%, with the lowest ideal usage in New Brunswick and PEI, and the highest in British Columbia. (show/hide results)
Driver Adjustment Rates by Region |
|||||
Headrest Adjustment |
|||||
Region |
Good |
Marginal |
Poor |
Very Poor |
Total* |
|
(%) |
(%) |
(%) |
(%) |
(%) |
BC |
18 |
36 |
26 |
20 |
100 |
AB |
16 |
28 |
38 |
19 |
100 |
ON |
13 |
32 |
34 |
21 |
100 |
NS |
12 |
36 |
39 |
13 |
100 |
NB |
7 |
35 |
28 |
30 |
100 |
PE |
8 |
35 |
35 |
23 |
100 |
NF |
15 |
30 |
38 |
17 |
100 |
Total |
14 |
32 |
33 |
20 |
100 |
*Total might not add up to 100% due to rounding errors |
|||||
- Female drivers were three times more likely than males to have their headrests adjusted in the good position (23% versus 7%). (show/hide results)
Driver Adjustment Rates by Gender |
|||||
Headrest Adjustment |
|||||
Gender |
Good |
Marginal |
Poor |
Very Poor |
Total* |
|
(%) |
(%) |
(%) |
(%) |
(%) |
Males |
7 |
27 |
38 |
28 |
100 |
Females |
23 |
38 |
28 |
11 |
100 |
- Headrest adjustment does not appear to vary appreciably in drivers in the 20-59 age range.
- Large cars and light trucks were much less likely to have their headrests adequately adjusted. Only 6% of large cars and 4% of light trucks (compared to 14% for the total sample) had their headrests ideally adjusted. (show/hide results)
Driver Adjustment Rates by Vehicle Type |
|||||
Headrest Adjustment |
|||||
Vehicle Type |
Good |
Marginal |
Poor |
Very Poor |
Total* |
|
(%) |
(%) |
(%) |
(%) |
(%) |
Small Car |
16 |
36 |
32 |
16 |
100 |
Medium Car |
14 |
32 |
33 |
21 |
100 |
Large Car |
6 |
17 |
38 |
39 |
100 |
Light Truck |
4 |
18 |
38 |
40 |
100 |
Van |
11 |
31 |
36 |
22 |
100 |
SUV |
18 |
36 |
32 |
14 |
100 |
Total |
14 |
32 |
33 |
20 |
100 |
*Total might not add up to 100% due to rounding errors |
|||||
Study findings for front-seat passengers
- Female passengers were much more likely than males to have their headrests adjusted in a good position (21% versus 15% respectively). (show/hide results)
Passenger Adjustment Rates by Gender |
|||||
Headrest Adjustment |
|||||
Gender |
Good |
Marginal |
Poor |
Very Poor |
Total |
|
(%) |
(%) |
(%) |
(%) |
|
Males |
15 |
28 |
32 |
26 |
329 |
Females |
21 |
46 |
22 |
11 |
741 |
- Passengers were more likely than drivers to have their headrests in a good position (19% versus 14%).
- Headrest adjustment does not appear to vary appreciably in passengers in the 20-59 age range.
- Whether the headrests were fixed or adjustable, there was little difference in the rate of marginal adjustment. In vehicles with adjustable headrests, only 30% of the headrests were in the "up" position. (show/hide results)
Adjustment Rates by Headrest |
|||||
Headrest Adjustment |
|||||
HR Position |
Good |
Marginal |
Poor |
Very Poor |
Total |
|
(%) |
(%) |
(%) |
(%) |
|
Up |
26 |
48 |
14 |
12 |
252 |
Down |
15 |
37 |
30 |
18 |
597 |
- This study found that 15% of headrests were fixed and 85% were adjustable. There was little difference in the proper positioning of fixed and adjustable headrests; that is, 43% of fixed and 48% of adjustable headrests in the "up" position were rated marginal.